

Mastering the Case Study: Strategies for Tackling Business Operations Challenges
Mastering the Case Study: Strategies for Tackling Business Operations Challenges
Issue 06 - Introducing a bonus series :)

★ HAPPY THURSDAY ★
Welcome to The Contrarian. In my last analysis, To Hack Culture, Focus on Employee Motivators, we reviewed how to use an employee’s intrinsic values to shape an amazing company culture. Today, we are taking a trip down memory lane and reviewing some of my old work. I will have another post on leadership & company culture published this weekend.In the meantime, find me on Instagram and LinkedIn. :)
❃ INTRODUCTION ❃
This is a fun little bonus series I’m doing on my page where I’m rating my old case studies and presentations. I’m not sure if this is the best way to present this information, but it’s trial and error. So, we’ll see how it goes and adjust if necessary.
Lately, there has been a noticeable uptick in the prevalence of case studies and presentations as part of the interview process for many companies. I have done countless case studies and presentations, and I want to rate and analyze my own work.
I figured it would help me identify gaps in my thinking while also assisting those that are asked to complete presentations or case studies for themselves.
I have material from almost a decade of work, so I want to see how much my approach has evolved and if there is anything I would do differently (which I’m sure there is).
Whether you’re asked to present a deck at work or for an interview… or if you’re just curious about business operations and strategy, then I hope this article helps!
◃: BACKGROUND :▹
To keep this brief, my background is in operations, strategy, sales, and HR. I’ve primarily worked in healthcare, but I’ve also worked in the non-profit space.
I have led and managed teams for 7+ years (which is the reason my content is centered around leadership and personal growth), but I love anything and everything around people and process. I am passionate about identifying gaps within an organization through data analysis, devising strategies and plans using OKRs and KPIs, rallying a team around these initiatives, and spearheading the implementation phase. I particularly enjoy the trial and error aspect of the process and thrive on rapid execution, mainly because I love challenging my thinking and problem-solving.
To hone my skillset, I joined a community called The Commons where I learned new technical skills (SQL and Tableau) and paired it with my knowledge of business operations and strategy.
At The Commons, I joined an 8-week accelerator where I was grouped with a mentor (Fernando Fernandez, Growth Product Manager at Yelp) and a team of 2 other people (Nai Louza, Senior Associate at PwC and Jack Sullivan, Investor Solutions at Moonfare)- my team members and I were tasked to act as the Head of Business Operations for a company called Juniper.
⭒⭒THE CASE ⭒⭒
Juniper is an on-demand delivery platform that connects merchants and customers through couriers. Customers purchase goods (mostly food) though the Juniper app, and couriers pickup the requested items from merchants and deliver the items to the customer. Think DoorDash or UberEats.
They have been in business for one-year and have successfully launched in 10 cities around the United States. They have completed 1,000,000 deliveries to date.
Juniper launched in NYC six weeks ago, and Dan, the Head of Business Operations (aka our team) was asked to submit a proposal to Juniper’s CEO with the company’s performance in NYC thus far.
Here is the information we were given:
Dan joined Juniper two months ago, and his goal is to figure out the most efficient and fastest way to connect the different sides of the marketplace. Dan wants to understand all the parts of a delivery but has not yet had the time to complete a comprehensive analysis yet.
Dan’s Objectives and KPI’s @ Juniper:
No. of drivers
Trips per driver
Avg. Time to Delivery
Avg. Order Value
In this 8-week project, we had access to Juniper’s entire database. Our team used SQL to conduct our analyses and Tableau for data visualization. And then at the end of the 8 weeks, we presented our deck to a group of mentors who acted as Juniper’s CEO.
**Juniper is not a real company - the numbers and data listed were taken from a dataset provided by The Commons.
✮ OVERVIEW ✮
After conducting an in-depth analysis on Juniper’s performance after its first 6 weeks in the NYC market, we found:
COURIERS:
578 total couriers at Juniper
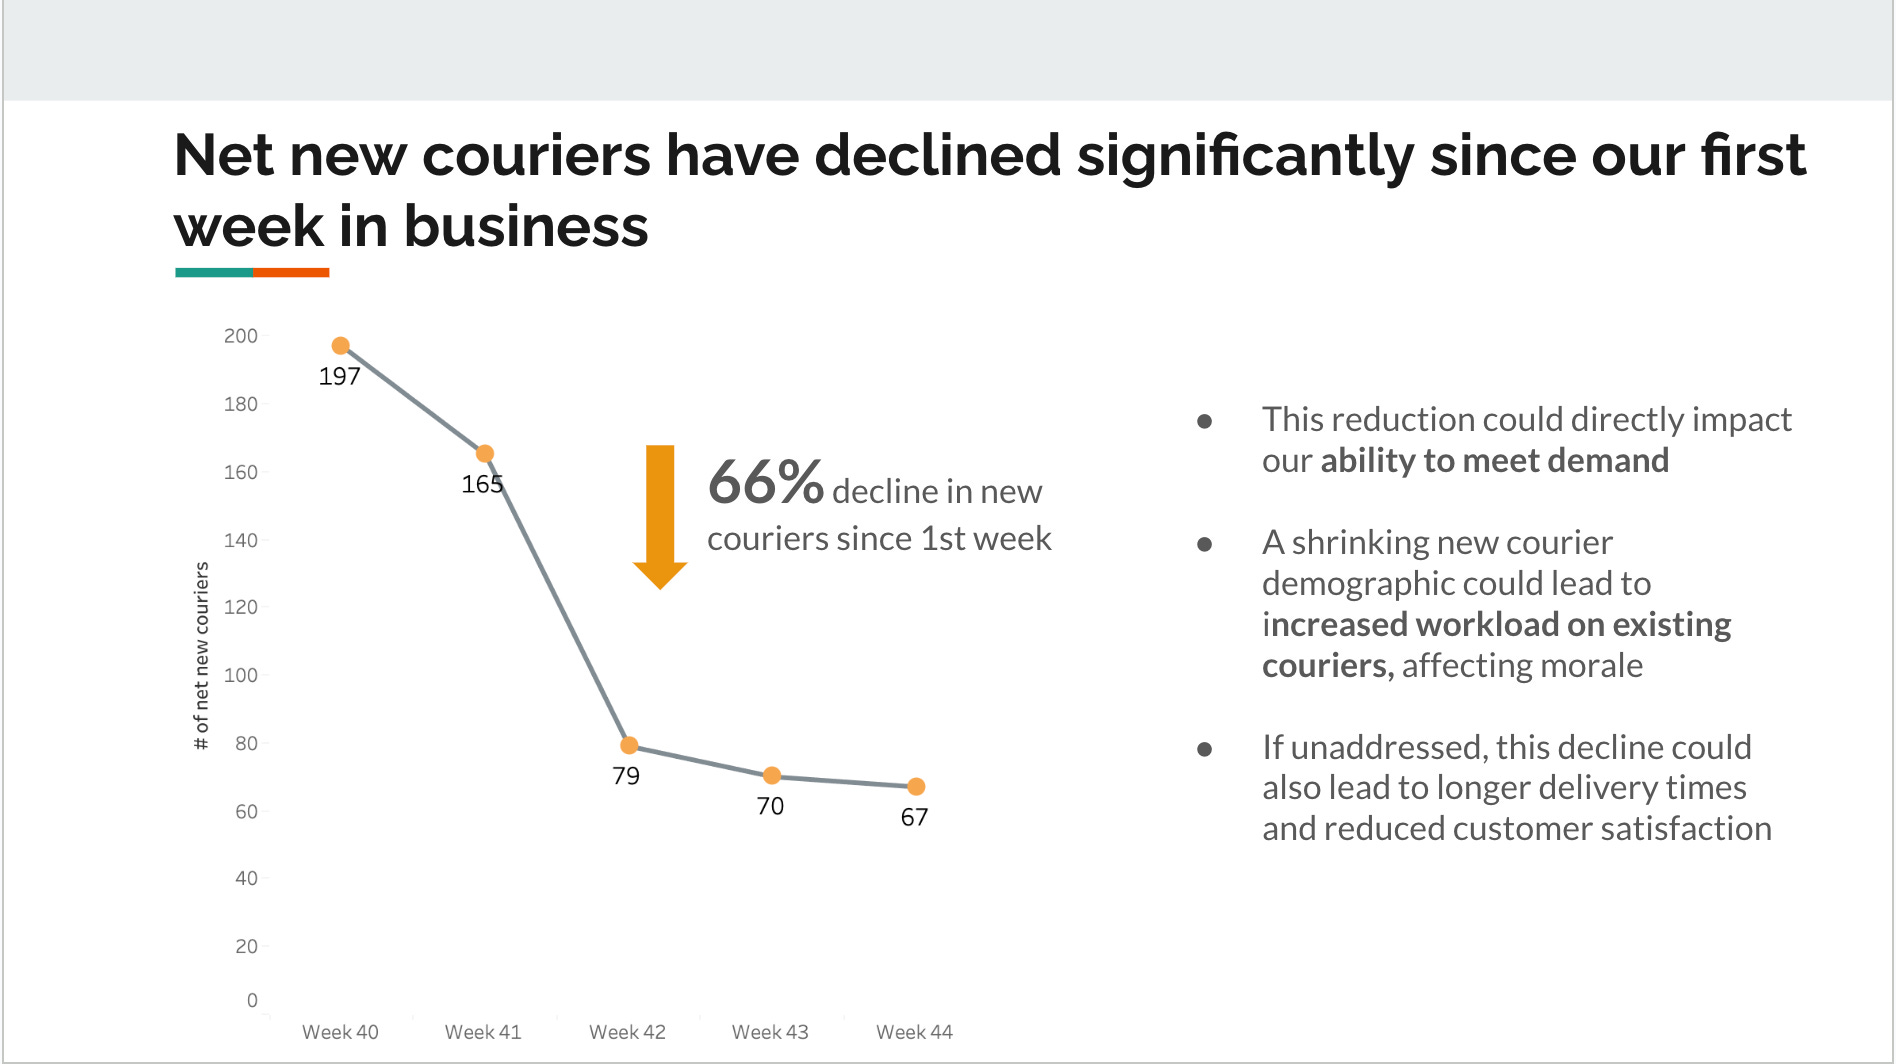
The number of net new couriers declined each week, dropping 66% since our first week.
On average, it took 43 minutes to deliver items.
RETAILERS:
493 total retailers at Juniper
The number of new merchants increased 66% after week 1; then fell flat.
CUSTOMERS:
2,790 total customers at Juniper accounting for $126,000 in revenue.
Revenue peaked in week 3 with $33,000 in revenue but has since fallen to $28,000 in our last week.
On average, customers ordered $25.74 worth of items.
❃ OUR ANALYSIS + FINDINGS ❃
We started with the couriers, specifically, we looked at courier retention & new courier activations - both of which have declined since Juniper’s first week in business:
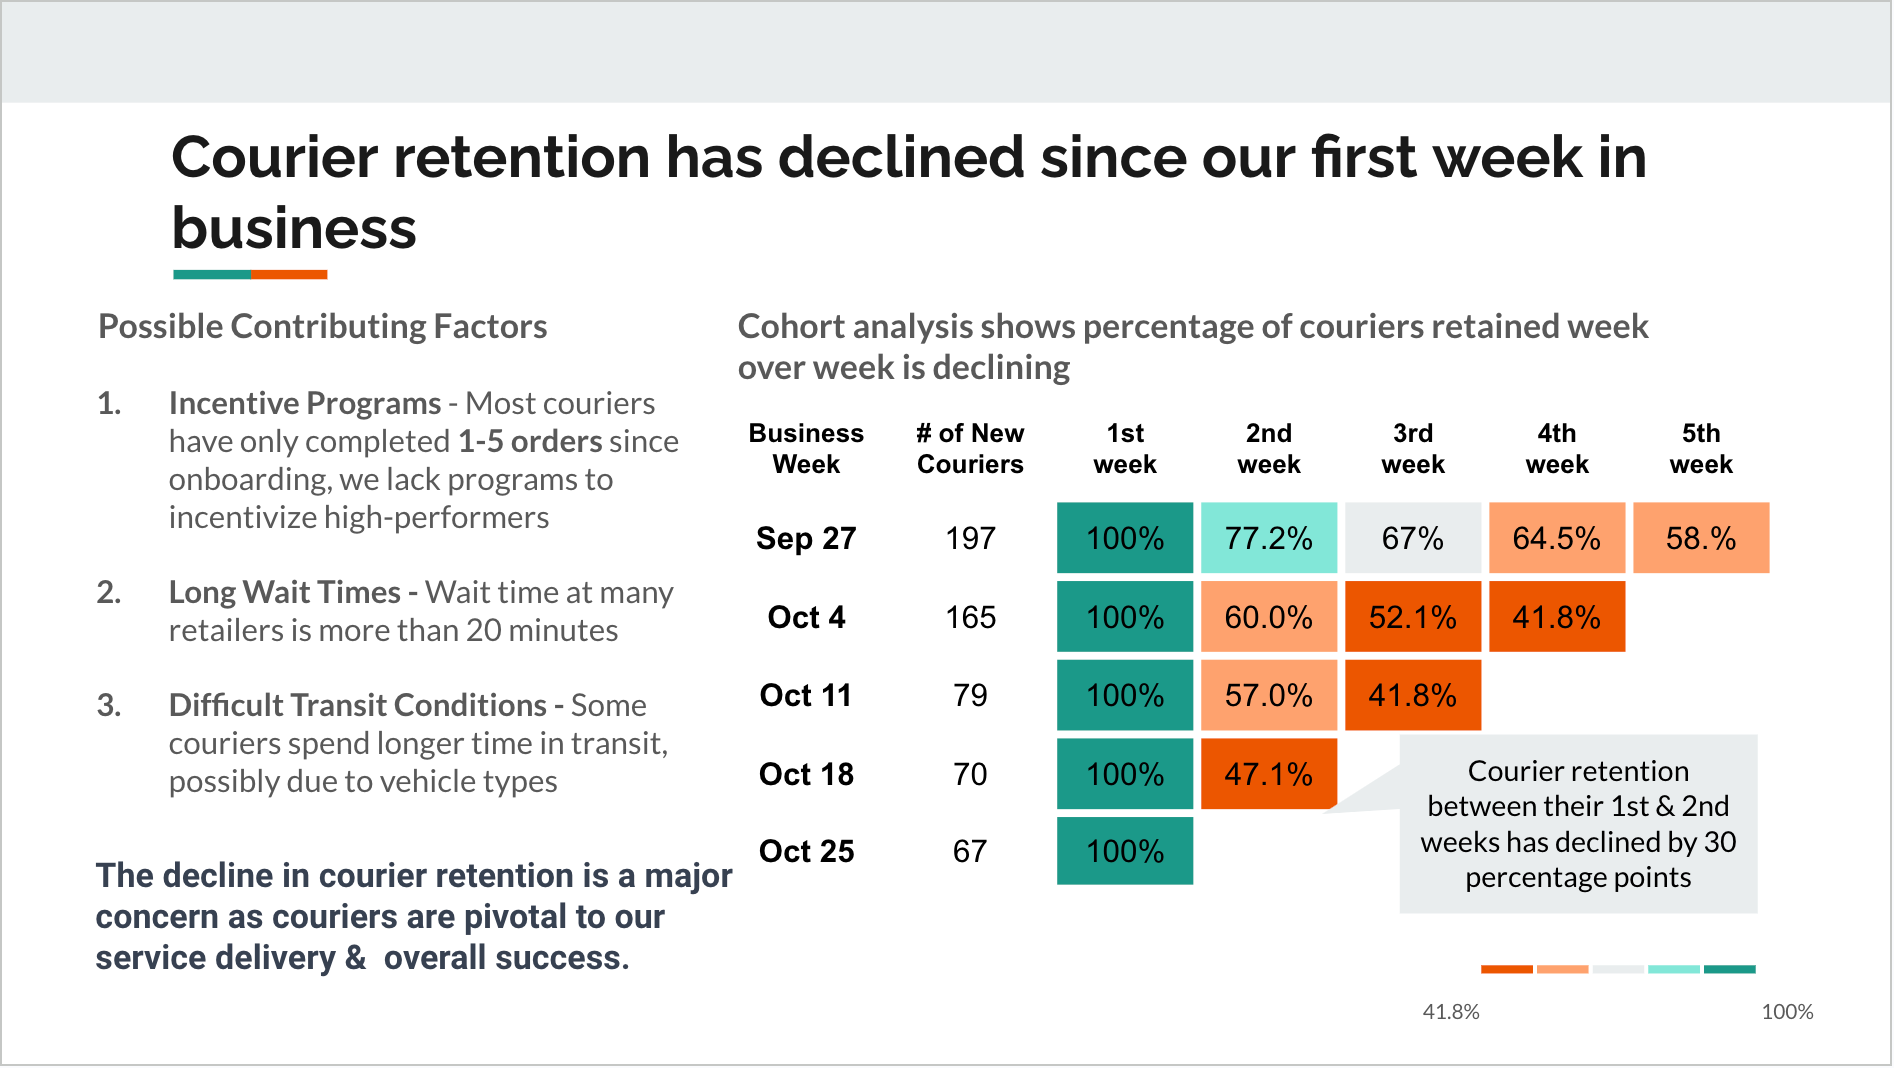
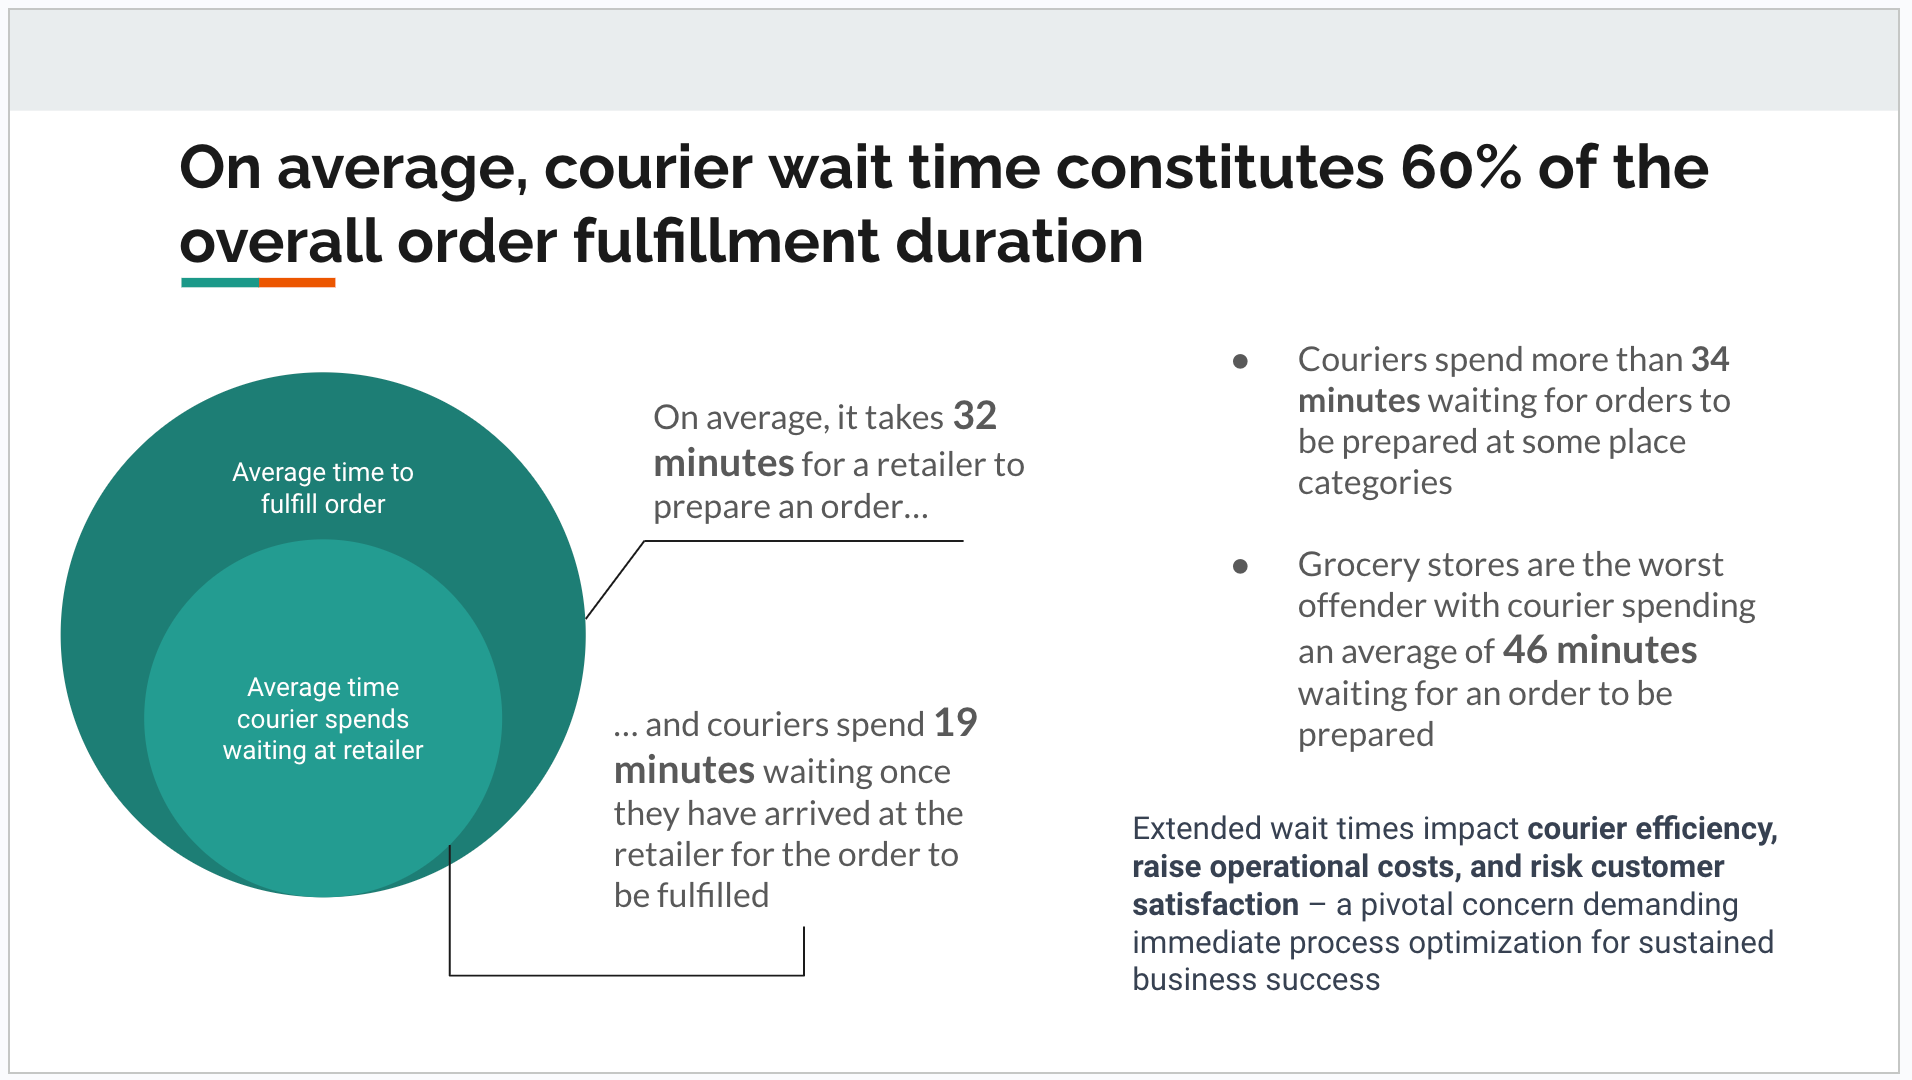
We found data suggesting that the average time to complete a delivery was 43 minutes from when a customer placed an order to when a courier dropped the order off. We wanted to see if delivery time had an impact on customer satisfaction.
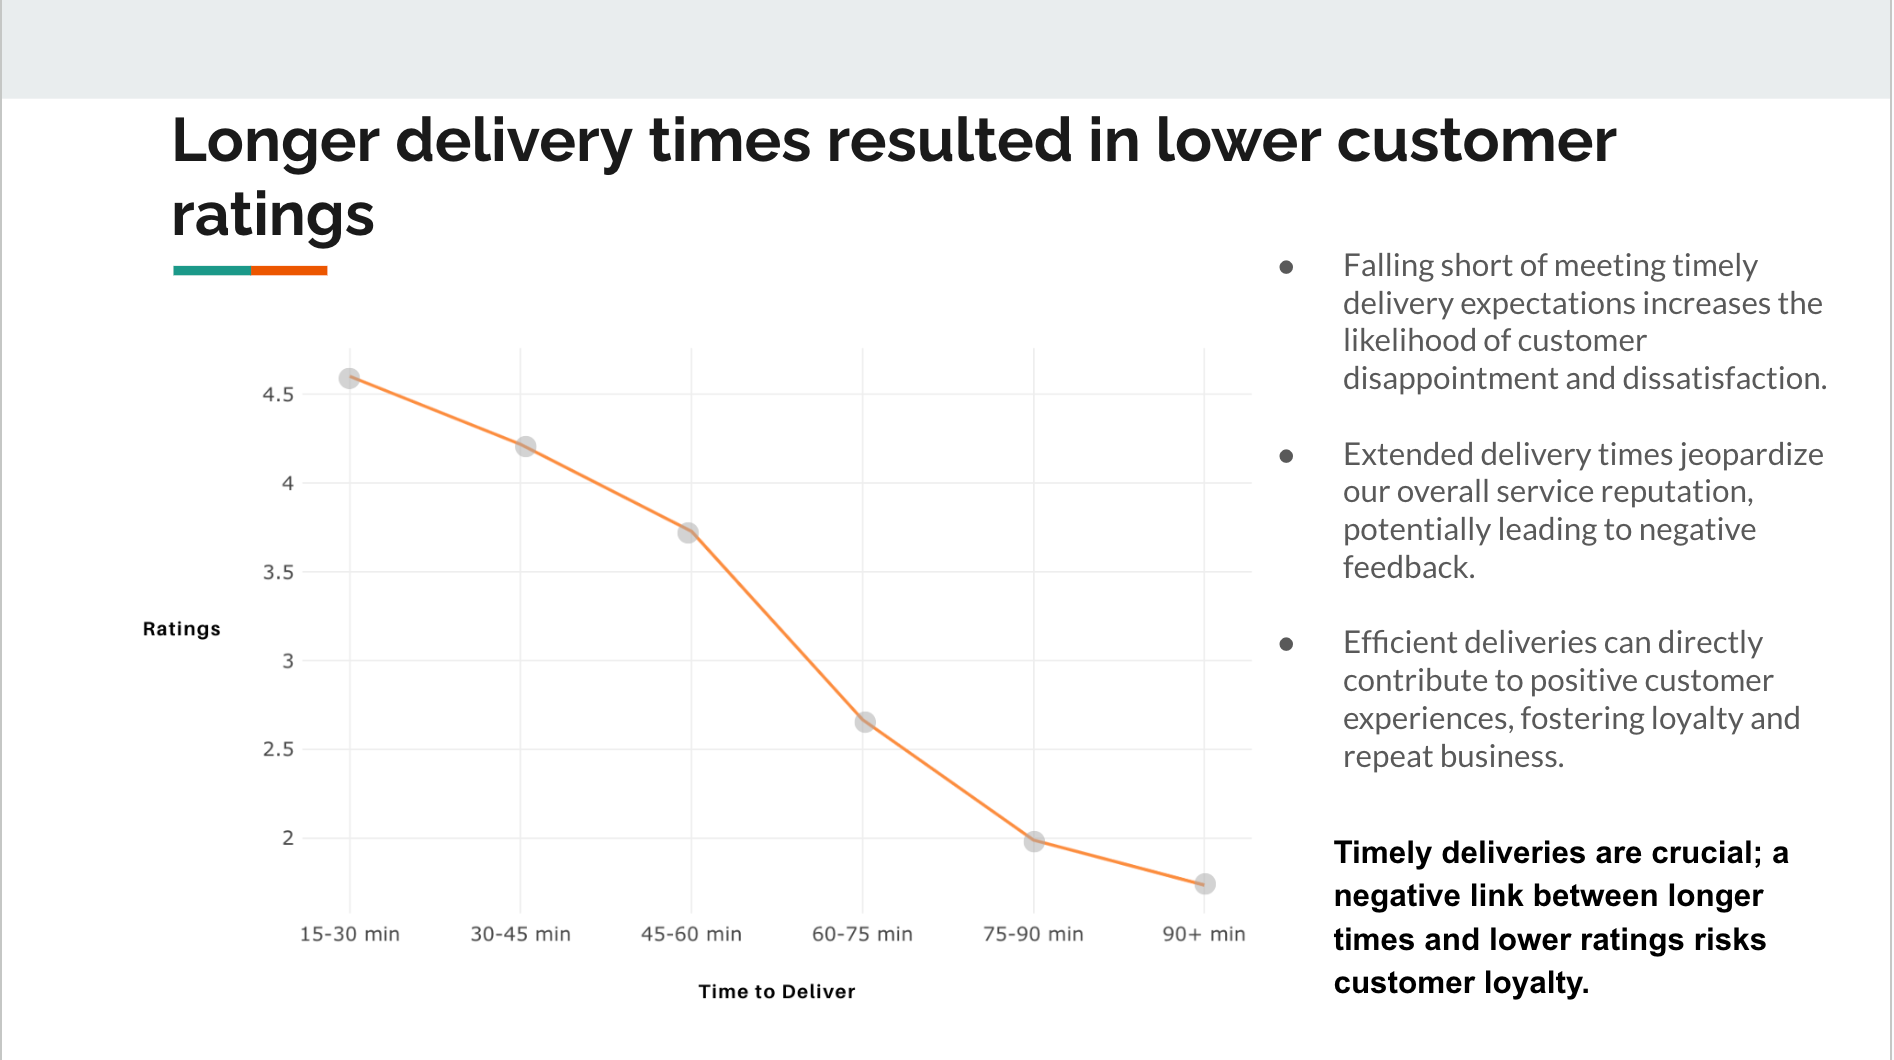
The longer the delivery takes, the less satisfied the customer. But what was causing this? Was it because we didn’t have enough couriers to meet demand or were there other contributing factors?
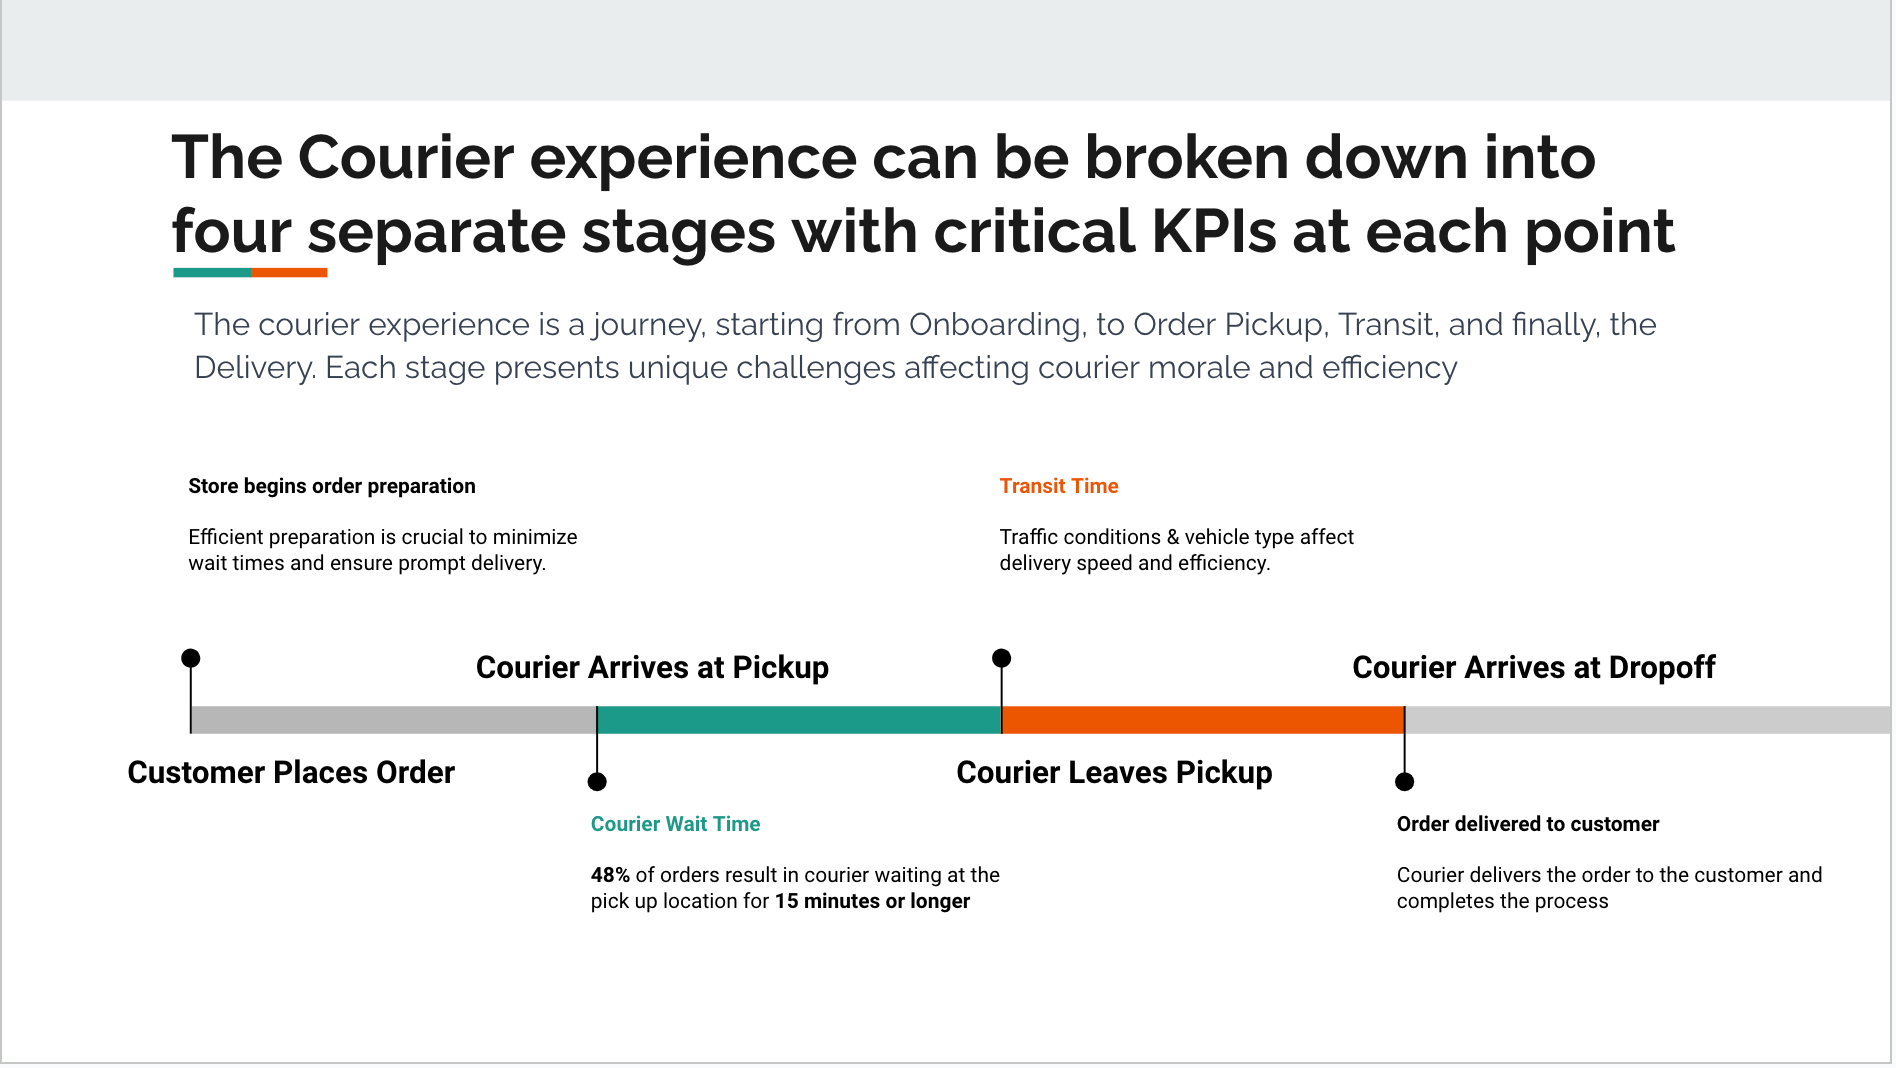
On average, couriers were waiting 19 minutes once they arrived at the retailer for the order to be completed. This obviously contributed to longer delivery times.
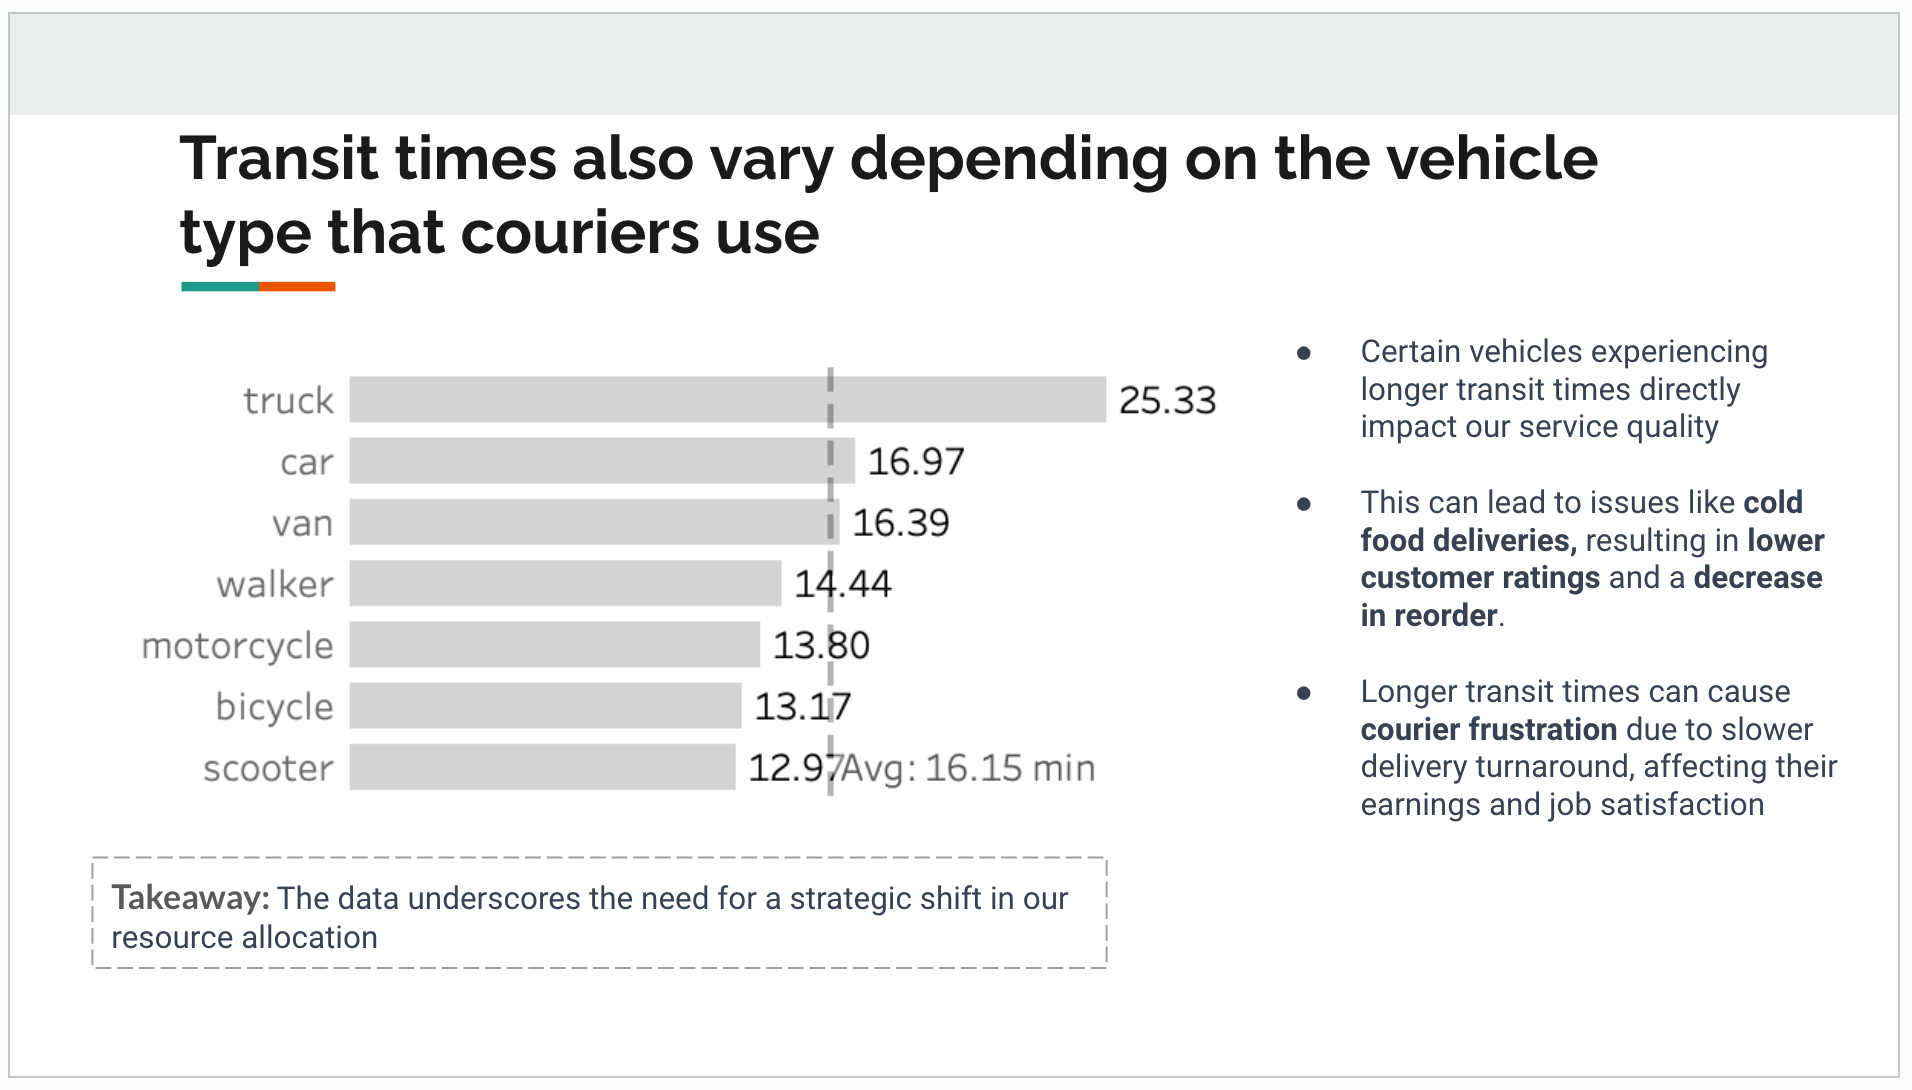
We also found that the vehicle a courier uses contributes to longer wait times in NYC.
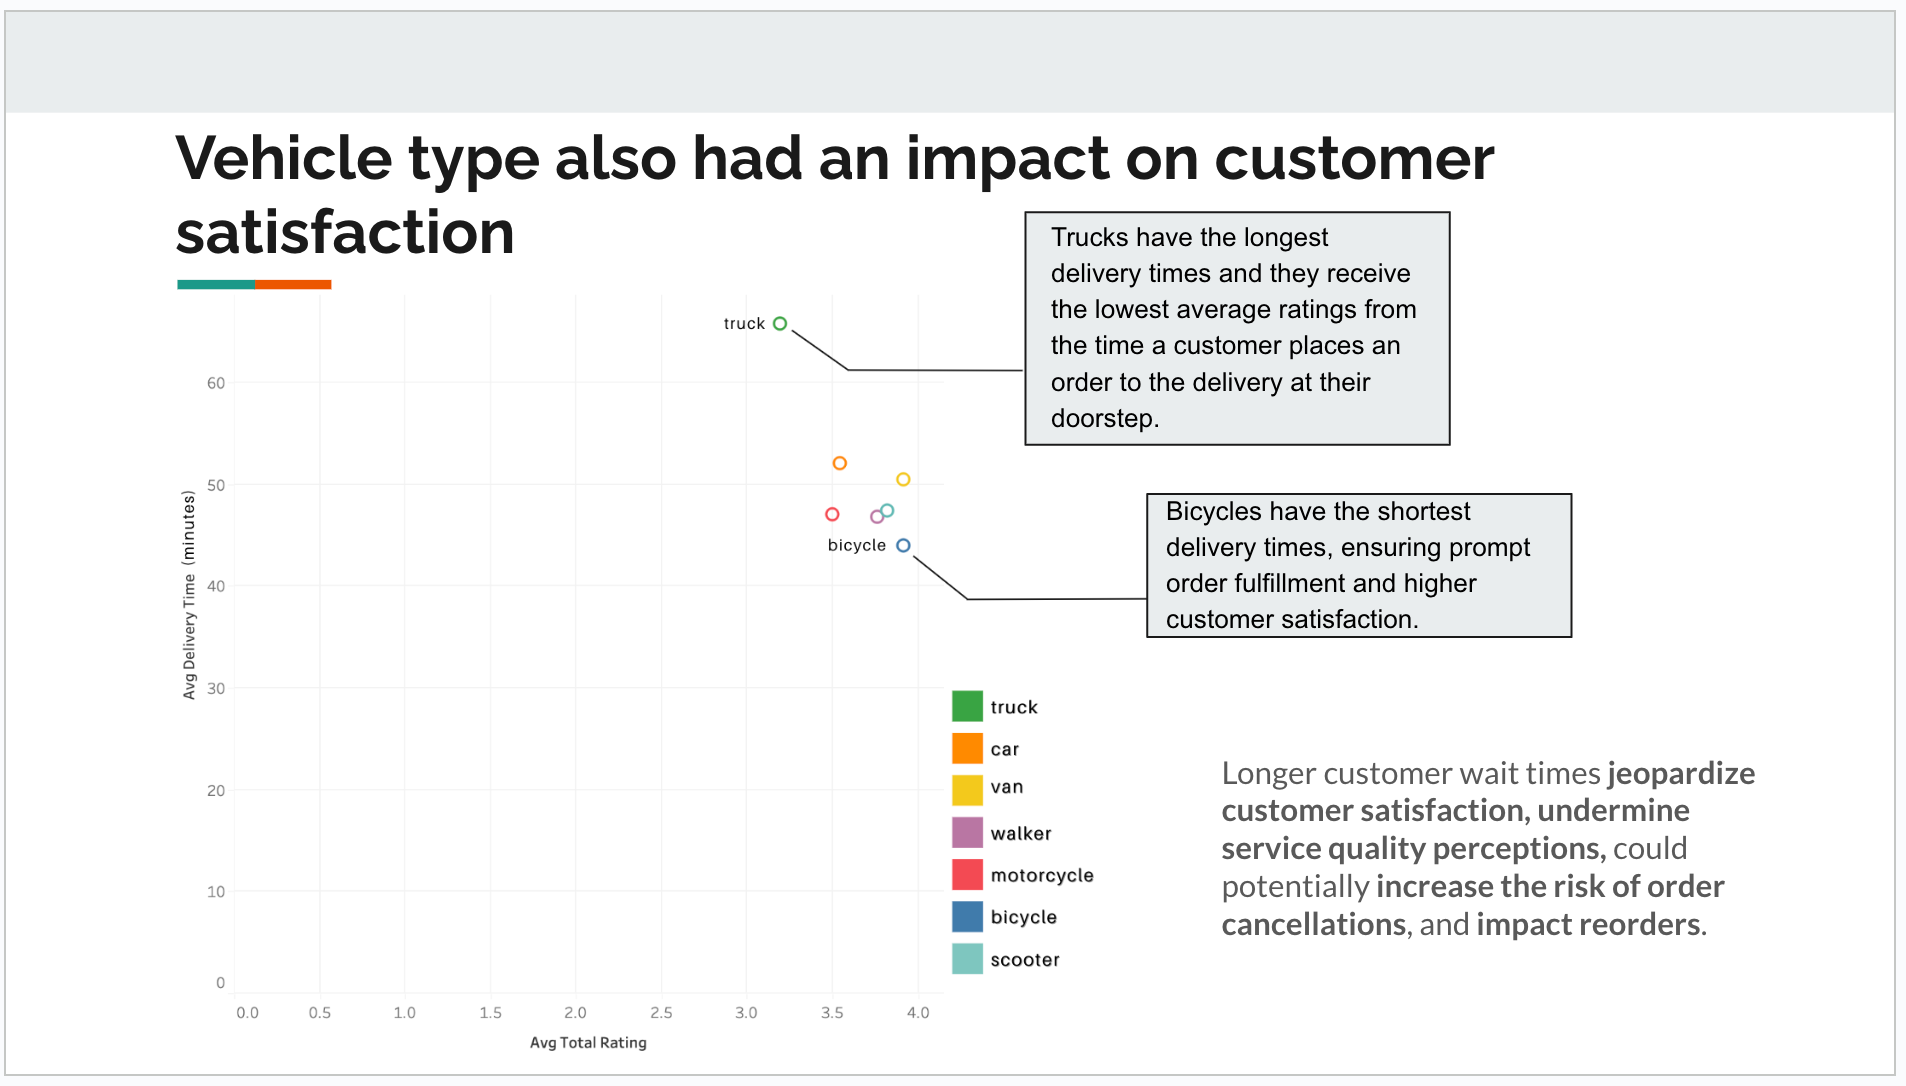
Vehicle type also had an impact on customer satisfaction:
After reviewing this data, we concluded that there are improvements that can be made to the courier side of the marketplace. Our team also decided to look into revenue and customer behavior, and we found some interesting insights:
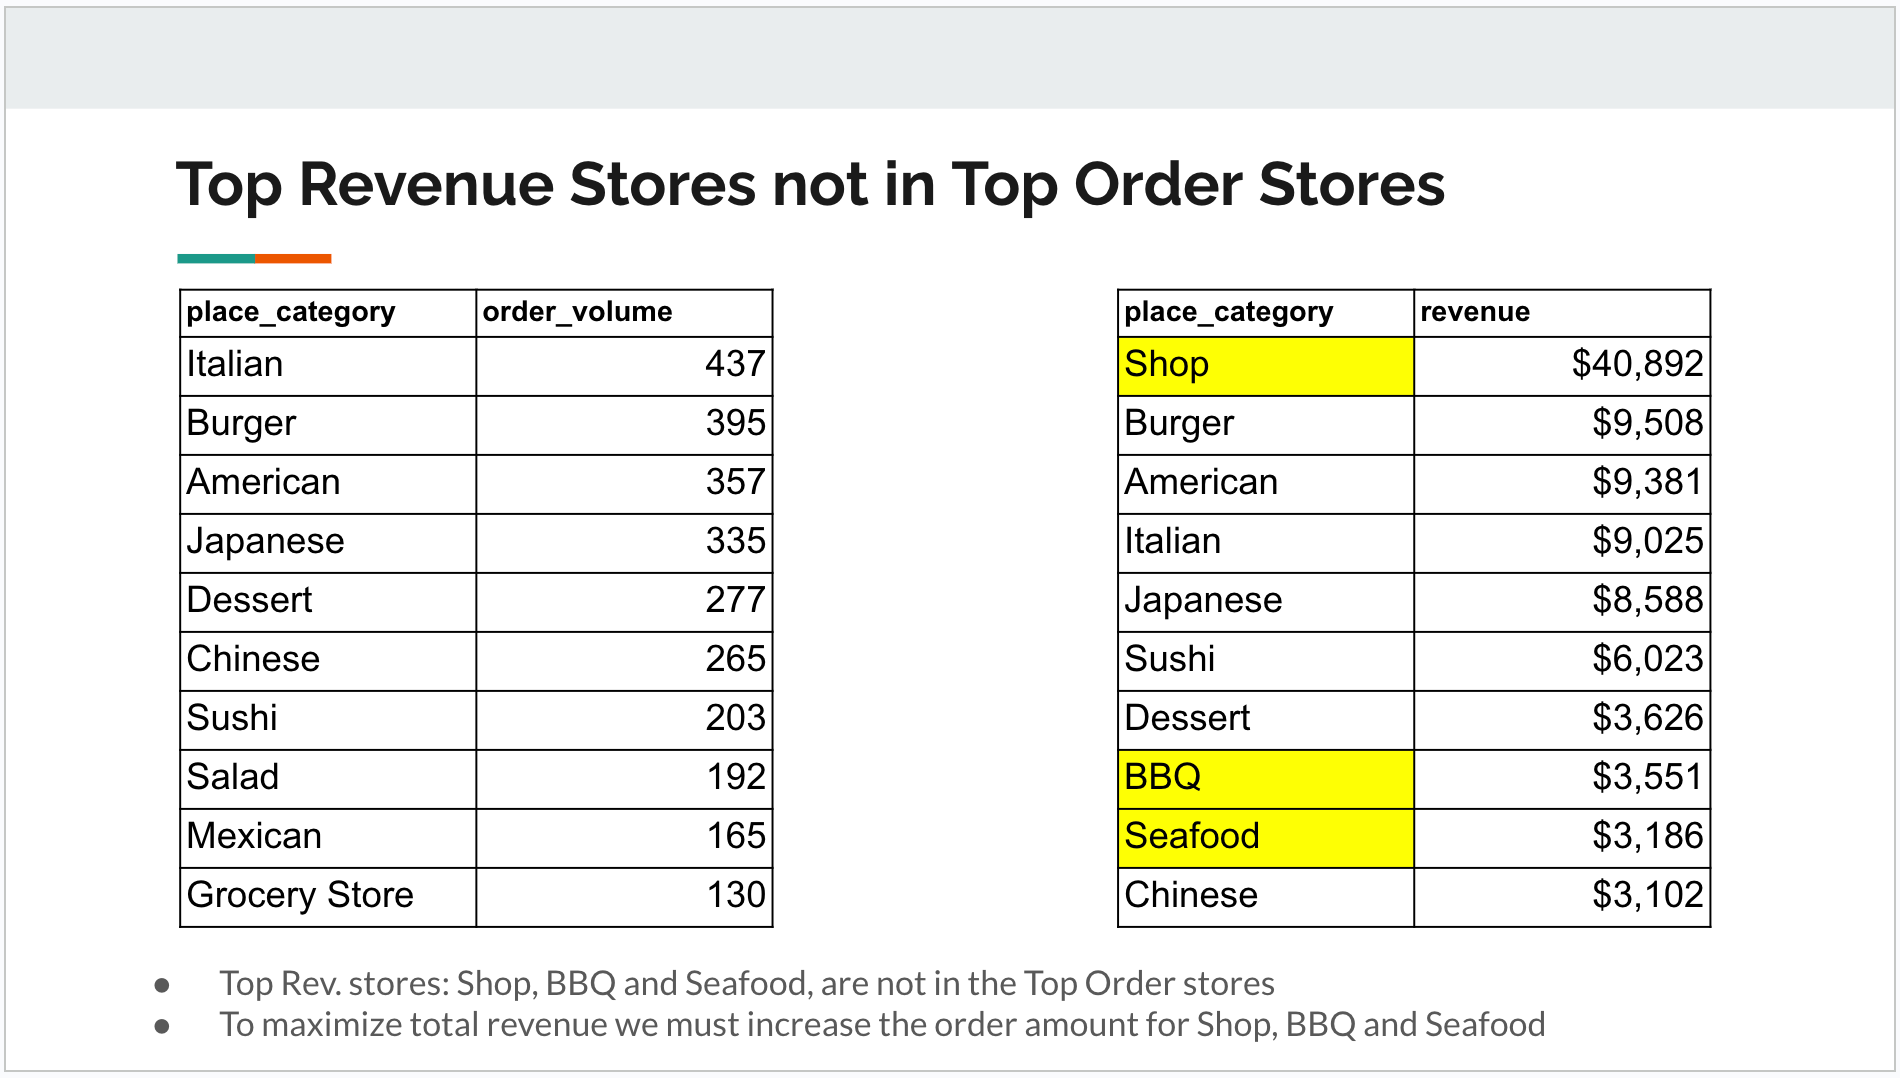
We learned that more customer orders do not necessarily always mean more revenue. In fact, the ‘Shop’ category accounted for 29.5% of Juniper’s total revenue. When we dug deeper, we found that the ‘Shop’ category consisted of a single store, a liquor store located in the Lower East Side.
So, this one liquor store accounted for almost 30% of Juniper’s total revenue during its first 6 weeks in NYC.
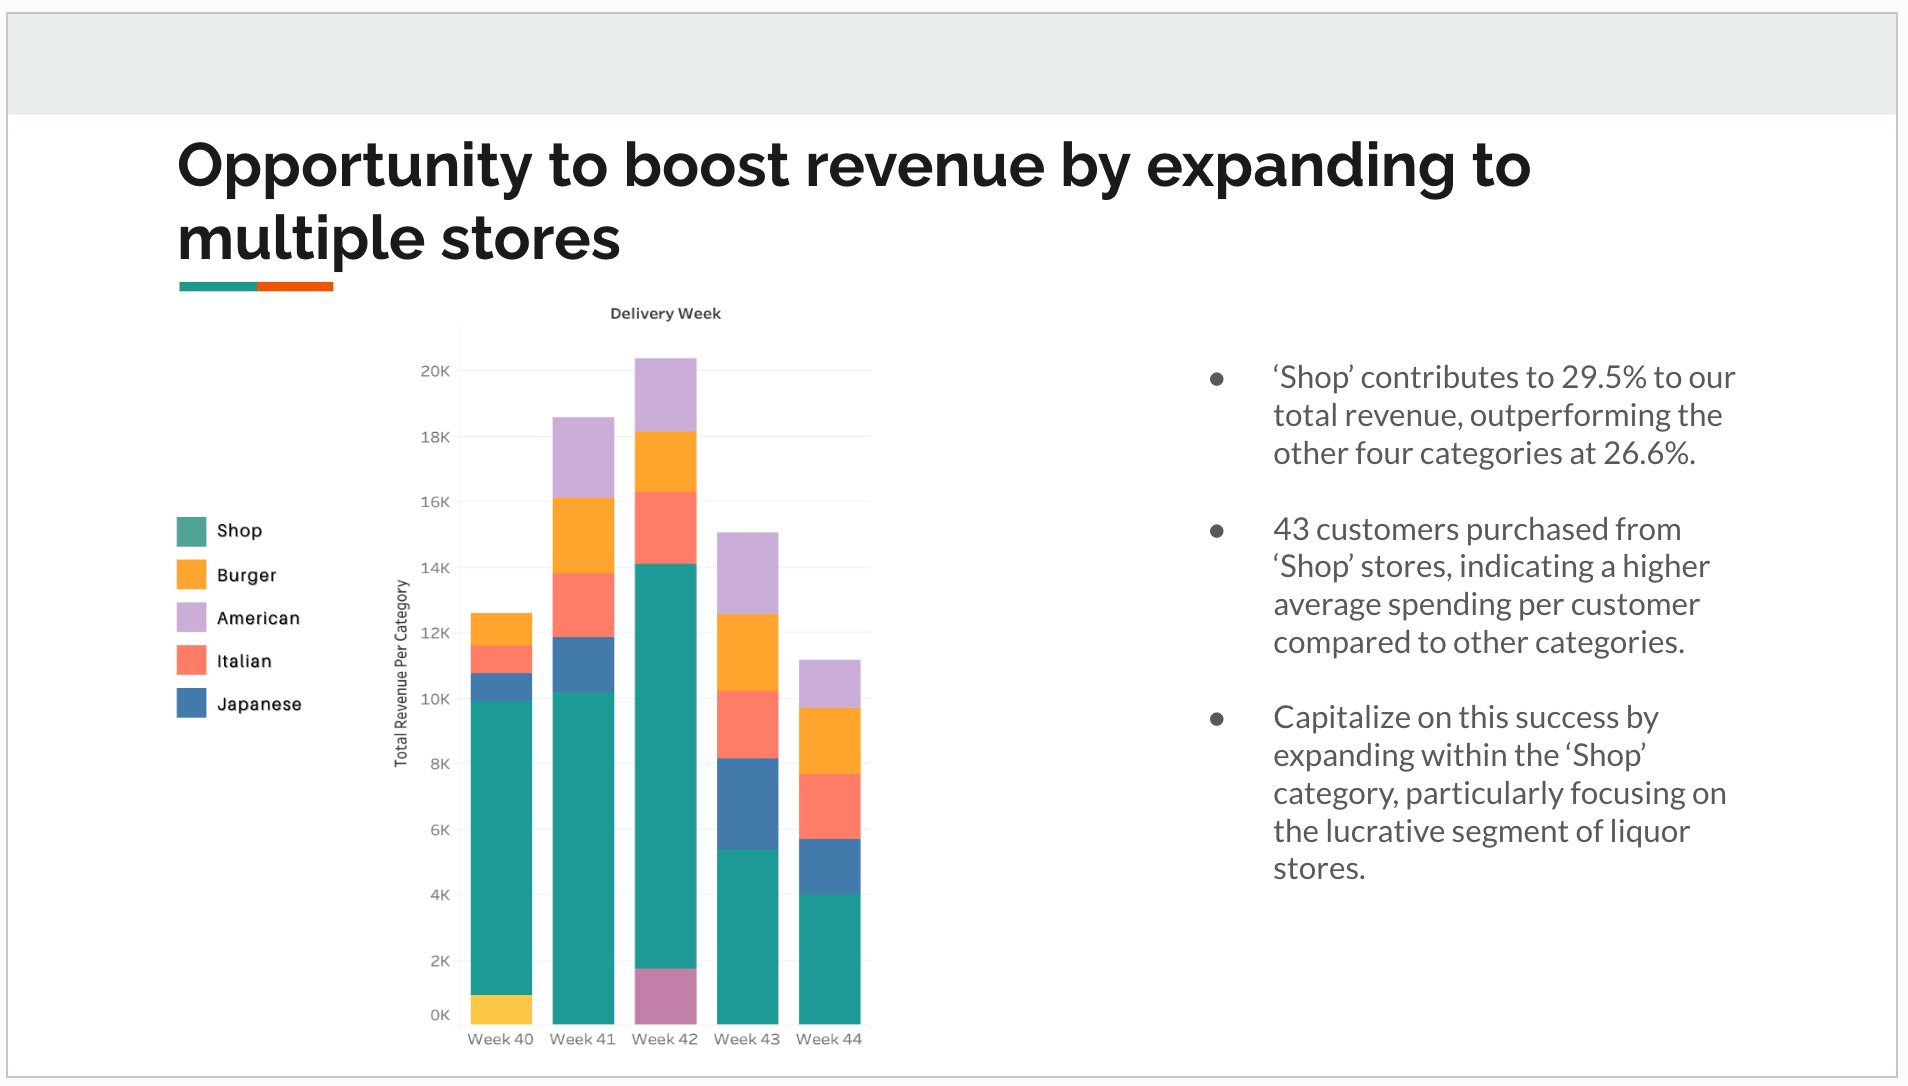
43 customers shopped at the liquor store, indicating a higher average order value.
Next, we brainstormed what initiatives we could put in place to improve new courier activations, courier retention, customer satisfaction, new customers, delivery time, and most importantly, revenue.
⭒ NEW INITIATIVES ⭒
♡ PARTNERSHIP WITH CITI BIKE ♡

Our Citi Bike partnership accelerates courier efficiency, reduces transit times, and fosters eco-friendly practices, ultimately enhancing customer satisfaction and driving platform growth.
What is it? —
Bicycles have the shortest delivery times and the highest customer ratings. With a decrease in new couriers, we’re partnering with Citi Bikes to attract more couriers, reduce delivery time, and increase customer satisfaction.
How it works —
New couriers that sign up with Juniper get a discount on their Citi Bike membership. Juniper will cover 50% of the courier’s monthly membership cost, seamlessly linked during onboarding.
Impact —
Enhanced Customer Satisfaction:
Faster deliveries translate to improved customer satisfaction.
Boost in Customer Orders:
Higher customer satisfaction anticipates an increase in customer orders, driving revenue growth.
Partnership with Citi Bike will generate more brand awareness for Juniper.
Increased Courier Onboarding:
Incentivizing couriers with discounted Citi Bike memberships aims to attract more couriers to the Juniper platform.
♡ PARTNER WITH LIQUOR STORES ♡
Capitalizing on the success of our high revenue generating liquor store, we propose partnering with additional liquor stores to amplify revenue and customer satisfaction, ultimately driving platform growth.
What is it? —
Our data reveals that a single liquor store in the Lower East Side accounted for nearly 30% of Juniper's total revenue during our first 6 weeks in NYC. By partnering with more liquor stores, we aim to replicate this success and boost overall revenue.
How it works —
Identify top-performing liquor stores in strategic locations across NYC.
Establish exclusive partnership agreements with these stores, offering them enhanced visibility on the Juniper platform.
Integrate these stores into our system, ensuring seamless ordering and delivery processes.
Launch targeted marketing campaigns to promote our expanded liquor store offerings to customers.
Impact —
Increased Revenue:
By onboarding additional high-performing liquor stores, we anticipate a significant boost in overall revenue, as demonstrated by the success of our initial liquor store partnership.
Enhanced Customer Satisfaction:
Offering a wider selection of liquor stores across various locations will improve convenience and choice for our customers, leading to higher satisfaction rates.
Expanded Customer Base:
Partnering with strategically located liquor stores will help us tap into new customer segments and expand our market reach.
Strengthened Brand Positioning:
Establishing Juniper as the go-to platform for liquor delivery will strengthen our brand positioning and differentiate us from competitors.
♡ A FEW OTHER INITIATIVES ♡
Offer referral bonuses to new drivers
Impact: attract new drivers & increase net new courier sign-ups
Create an algorithm to group and allocate orders placed around the same time from nearby retailers
Impact: increase orders per courier, increase courier pay and retention, maximizing efficiency and contributing to total revenue and growth
Introduce surge pricing: charge higher prices and provide more financial incentives to drivers during peak times
Impact: reduce wait times, improve courier retention and satisfaction
✮✮ MY RATING ✮✮
Overall, I’d say that this was a sound presentation. I would give it an 8/10. I think we did an excellent job collecting data, crafting a story, and creating new strategies.
However, I would have added more metrics on Dan’s last KPI mentioned above, average order value. More specifically, I’m curious to know if weekly avg. order value increased or decreased throughout the first 6 weeks in business. Segmenting AOV by category (food vs liquor for example) could yield useful insights, as well.
Understanding the AOV, could help Juniper with:
Performance tracking: Monitoring changes in the average order value over time can help Juniper assess the effectiveness of its strategies and identify areas for improvement.
Revenue forecasting: Juniper can predict its future revenue based on the number of orders we expect to receive, helping with financial planning and budgeting.
Pricing strategies: We can optimize its pricing strategies, such as setting appropriate delivery fees, minimum order values, or promotional discounts to maximize profitability.
Restaurant partnerships: Restaurants are more likely to partner with Juniper if they know that the platform can generate high-value orders.
Delivery driver compensation: Help determine appropriate compensation rates for its delivery drivers, ensuring that they are fairly compensated for their time and effort.
I would have also added more information to the initiatives I included above - Partnership with Citi Bikes and Partner with Liquor Stores, like potential risks, ROI, and a timeline.
As always, send me your thoughts, ideas, suggestions, questions. I hope that this resource was helpful to you - whether you’re interested in learning more about strategy and operations or if you were asked to complete a case for your company. I hope you can gain something out of this. I’ll have more case study and presentation reviews in the next coming weeks.
Sending you all so much love!!!
XOXO,
Palak